
Business Analytics and Data-Driven Decisions: A Beginner's Guide for Bahamian Business Owners
What Data-Driven Actually Means for a Bahamian Business
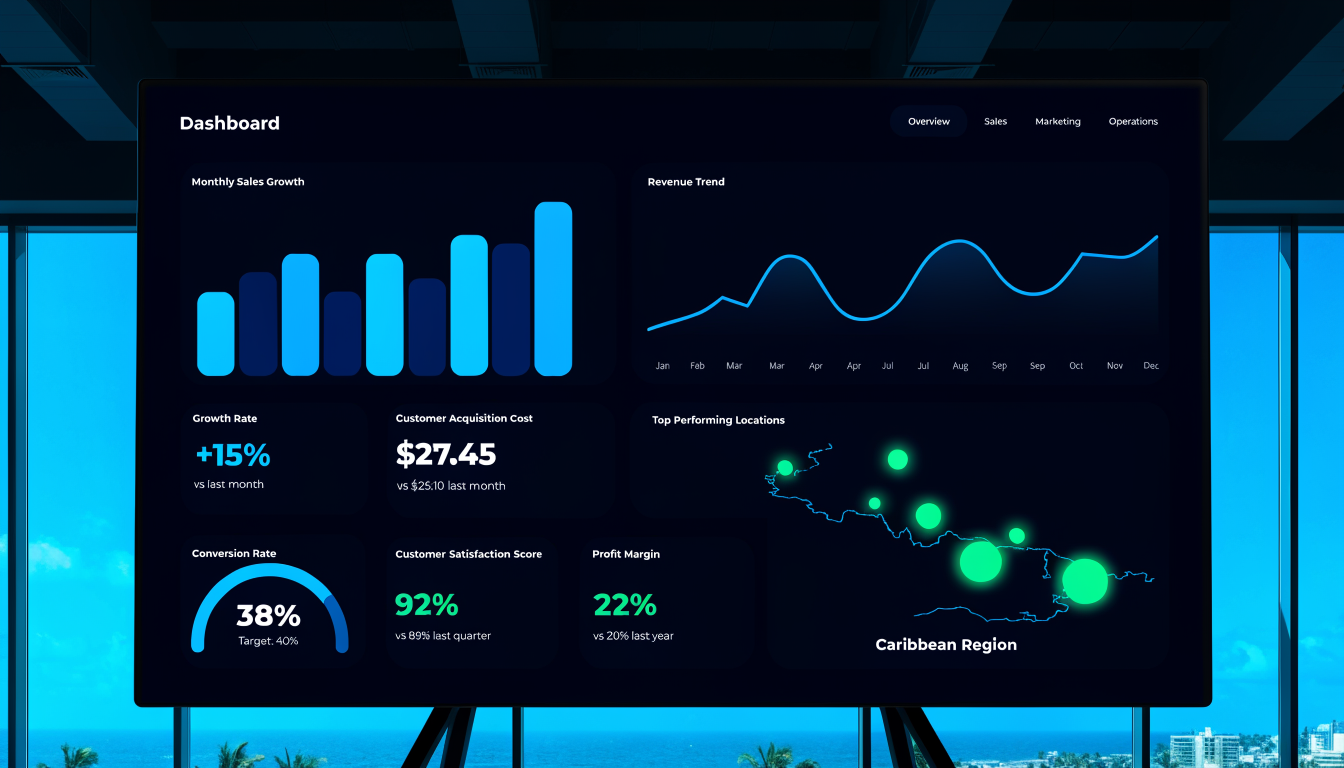
Data-driven decision-making means knowing the specific numbers that indicate whether your business is healthy, identifying them consistently over time, and letting those numbers inform your decisions. It does not mean building dashboards with hundreds of metrics. It starts with answering: what five numbers, if I tracked them every week, would tell me the most important things about my business? Those five numbers are your Key Performance Indicators — your KPIs.
Choosing the Right KPIs
Different businesses have different KPIs. Retail businesses should track: revenue per day/week, inventory turnover rate, average transaction value, return customer rate, and gross margin by product category. Service businesses: revenue per billable hour, proposal-to-close rate, client retention rate, average project value, and utilisation rate. Restaurants: revenue per table turn, food cost percentage, labour cost percentage, and average check value. Any business: monthly revenue vs. same period last year, cash position and accounts receivable, customer acquisition cost, and customer lifetime value.
Start with three to five KPIs. Track them weekly. Your first goal is simply to have consistent, accurate data — once you have it, patterns emerge.
The Tools That Make It Possible
A well-structured Google Sheet is enough for many businesses. Build a template with your five KPIs, enter data every Monday morning, create a simple line chart. This costs zero dollars and is more useful than most businesses have.
Google Looker Studio (free) connects to multiple data sources — your Google Analytics, Google Ads, a Google Sheet, your CRM — and displays them in a unified dashboard. Zoho Analytics connects to your Zoho CRM, Books, and other tools to create automated dashboards with no manual data entry. Your accounting software reports — the profit and loss, accounts receivable aging, and cash flow reports built into QuickBooks, Xero, or Zoho Books — contain most of what you need. Most businesses do not use these enough.
A Simple Analytics System for a Bahamian SME
Daily: Revenue for the day. Weekly: Total revenue vs. prior week and vs. same week last year; outstanding accounts receivable; pipeline value. Monthly: Gross margin by product/service line; labour cost as a percentage of revenue; new clients added; client retention.
These 8–10 numbers, tracked consistently and reviewed monthly, give a small business more insight than most managers have. The consistency matters more than the sophistication.
Data does not make decisions. People make decisions. But people who make decisions with accurate, consistent data consistently outperform those who rely on memory and intuition alone. Start with five numbers. Track them for three months. You will not go back.
Tags
Ready to Transform Your Document & Records Management?
Get a free assessment and see how Docu Island can help your business
Get Free AssessmentRelated Articles
AI Tools for Bahamian Businesses: What's Actually Useful Right Now
The AI conversation often sounds like science fiction. This post cuts through the hype and focuses on what AI tools are doing practical, revenue-generating work for Bahamian businesses in 2029.
Jul 10, 2029Hurricane Season Business Continuity: The Digital Preparation Checklist for 2029
Hurricane season runs June through November. For Bahamian businesses, digital preparation isn't optional — it's the difference between recovery and closure. Here's the 2029 checklist that actually matters.
Jul 3, 2029Retail Automation for Bahamian Shops: Inventory, POS, and Beyond
Retail automation for Bahamian shops isn't about robots — it's about inventory tracking, POS integration, and reorder triggers that save time and prevent stockouts.
May 29, 2029